Bitcoin STH Still Holding Despite New ATH – Analyst Expects Profit Taking Around $126K
Bitcoin has finally entered unknown territory, surpassing its all-time high and reaching an astonishing $111,888 early today. This signifies the start of a new price discovery phase, which is causing enthusiasm in the market. While bulls maintain control, sentiment is far from jubilant. Many analysts advise caution, predicting a probable retracement as the market digests this move.
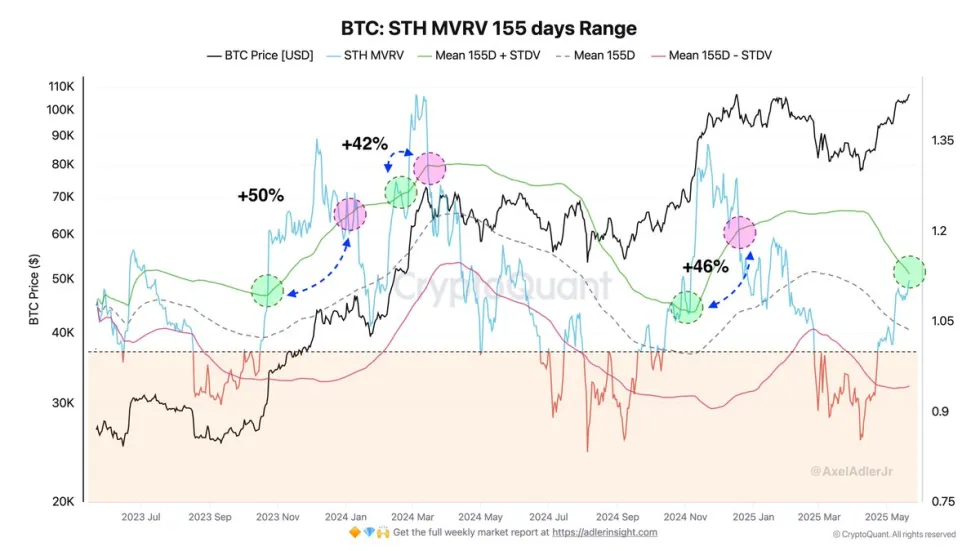
Top analyst Axel Adler provided timely insights, noting that the longevity of this rise is dependent on the actions of short-term holders (STH) and ETF speculators. According to Adler, the present STH MVRV (Market Value to Realized Value) ratio has not yet reached the “green” threshold of one standard deviation (+1 STDV), which has historically been associated with “super rallies.”
As of now, the facts indicate that there is still room for further growth. However, the risk appetite of STH and ETF participants will most likely determine whether Bitcoin continues to soar or pauses for a correction. With market sentiment cautious but bullish, all eyes are on whether this breakthrough will result in a sustained, high-momentum bull phase.
Bitcoin STH Risk Appetite and ETF Flows May Determine Next Move
Bitcoin is shown extraordinary resilience as it climbs amid mounting macroeconomic uncertainties. U.S. equities sank significantly Wednesday, spooked by rising Treasury rates, which projected tighter financial conditions ahead. In contrast, Bitcoin has continued to rise, reinforcing its rising importance as a hedge against traditional market volatility. Still, breaking over $115,000 is essential. Without such breakout, Bitcoin may lose momentum and have a major decline.
Adler emphasizes that this surge is dependent on the risk appetite of short-term investors (STH) and ETF-driven speculators. According to Adler, the present STH MVRV (Market Value to Realized Value) indicator has not yet exceeded the “green” threshold of one standard deviation (+1 STDV). Historically, this level has signaled the start of a “super rally,” a period in which prices rise fast until STH investors start taking profits.
Bitcoin STH MVRV 155 days Range | Source: Axel Adler on X
During prior rallies this cycle, Bitcoin rose by an average of 46% above the +1 STDV line. Based on today’s data, this suggests a possible high of almost $154,000. However, Adler cautions that the present late-stage environment may limit benefits. He expects selling to start around $126,000, primarily from ETF buyers who entered around $84,000.
While STH investors may be ready to wait out higher prices, ETF speculators might become a source of pressure. Their departures may precipitate the next drop, increasing the need for high purchasing volume to support the breakout. As Bitcoin rises to new highs, market behavior will most likely be determined by how both groups respond to the rising gains.
Technical Details: Bitcoin Enters Price Discovery
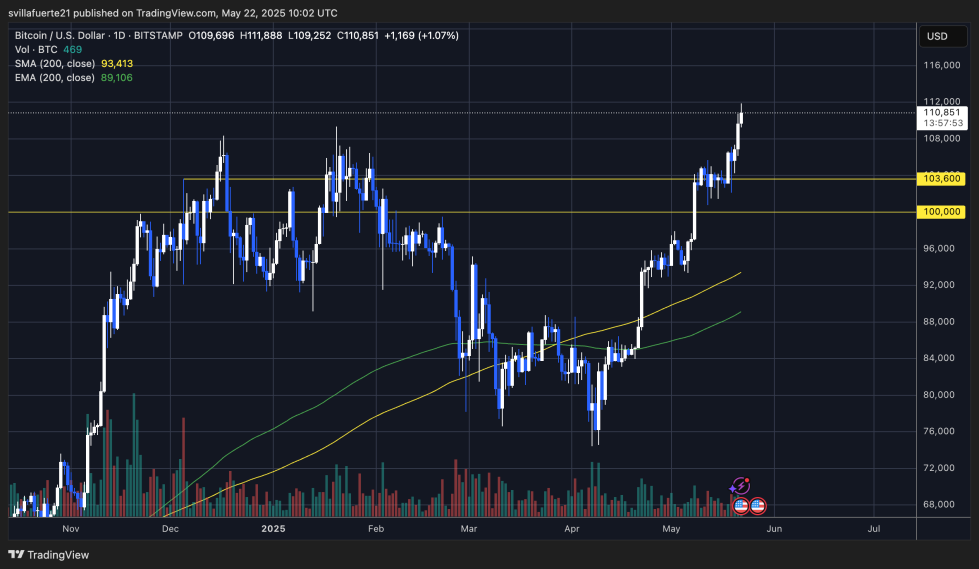
Bitcoin has officially entered price discovery after surpassing its previous all-time high, reaching $111,888 earlier today. Since the breakout over $100,000 in early May, the chart has shown a strong bullish structure with rising volume and higher lows. The momentum has remained continuous, with BTC remaining far above its 200-day simple moving average (SMA) of $93,413 and the 200-day exponential moving average (EMA) of $89,106, both of which currently serve as strong macro supports.
BTC breaking above ATH | Source: BTCUSDT chart on TradingView
After passing the $103,600 resistance zone cleanly, Bitcoin continued to advance with no reversal, indicating strong buying demand and little overhead supply. The absence of strong resistance in this new range raises the prospect of more rise. However, RSI-based overheating or financing rate surges may soon serve as short-term roadblocks.
Regardless of the bullish momentum, keep an eye out for any bearish divergences or signs of exhaustion near the crucial $115,000 mark. A closure over that level on solid volume will likely push the surge into the $120,000-$130,000 zone. On the downside, $103,600 and $100,000 have emerged as critical support levels. If bulls can maintain this structure and volume continues positive, the breakout might result in a long-term leg higher in this cycle.